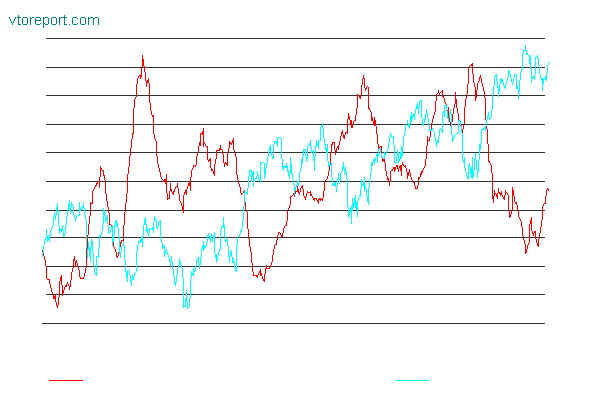
| Equity Only Equity & Index |
February 6, 2006 |
| Put/Call Ratio (Equity & Index
Options) Last 22 Days |
Date |
S&P 500 |
Call Volume |
Put Volume |
Total Volume |
Put/Call Ratio |
21-DMA |
01/05/06 |
1,273.48 |
1,217,690 |
754,592 |
1,972,282 |
0.620 |
0.790 |
01/06/06 |
1,285.45 |
1,524,392 |
1,037,917 |
2,562,309 |
0.681 |
0.786 |
01/09/06 |
1,290.15 |
1,612,635 |
1,111,368 |
2,724,003 |
0.689 |
0.781 |
01/10/06 |
1,289.69 |
1,487,716 |
1,049,439 |
2,537,155 |
0.705 |
0.767 |
01/11/06 |
1,294.18 |
1,680,177 |
1,059,668 |
2,739,845 |
0.631 |
0.758 |
01/12/06 |
1,286.06 |
1,362,688 |
1,009,912 |
2,372,600 |
0.741 |
0.761 |
01/13/06 |
1,287.61 |
1,116,575 |
871,847 |
1,988,422 |
0.781 |
0.769 |
01/17/06 |
1,282.93 |
1,403,979 |
1,092,987 |
2,496,966 |
0.778 |
0.773 |
01/18/06 |
1,277.93 |
1,506,909 |
1,432,445 |
2,939,354 |
0.951 |
0.799 |
01/19/06 |
1,285.04 |
2,039,518 |
1,769,030 |
3,808,548 |
0.867 |
0.801 |
01/20/06 |
1,261.49 |
2,586,473 |
2,804,347 |
5,390,820 |
1.084 |
0.808 |
01/23/06 |
1,263.82 |
1,651,496 |
1,452,756 |
3,104,252 |
0.880 |
0.791 |
01/24/06 |
1,266.86 |
2,026,645 |
1,150,791 |
3,177,436 |
0.568 |
0.785 |
01/25/06 |
1,264.68 |
1,506,713 |
1,289,843 |
2,796,556 |
0.856 |
0.789 |
01/26/06 |
1,273.83 |
1,499,335 |
1,045,975 |
2,545,310 |
0.698 |
0.790 |
01/27/06 |
1,283.72 |
1,587,061 |
1,272,323 |
2,859,384 |
0.802 |
0.780 |
01/30/06 |
1,285.20 |
1,296,701 |
858,088 |
2,154,789 |
0.662 |
0.772 |
01/31/06 |
1,280.08 |
1,160,241 |
943,741 |
2,103,982 |
0.813 |
0.767 |
02/01/06 |
1,282.46 |
1,187,150 |
1,100,133 |
2,287,283 |
0.927 |
0.773 |
02/02/06 |
1,270.84 |
1,224,396 |
1,179,022 |
2,403,418 |
0.963 |
0.783 |
02/03/06 |
1,264.03 |
1,089,175 |
1,181,273 |
2,270,448 |
1.085 |
0.799 |
02/06/06 |
1,265.02 |
959,111 |
806,454 |
1,765,565 |
0.841 |
0.810 |
Average put/call ratio since 01/02/01: 0.807 |
| Put/Call Ratio (Equity & Index Options) Daily Chart |
 |
|